Spark Uptime continuously monitors your infrastructure from multiple global locations to help detect outages, performance degradation, SSL/TLS issues, and service interruptions before they impact customers.
To improve accuracy, a target is only marked offline after a secondary monitoring location confirms the failure.
Supported monitor types
Spark Uptime supports multiple monitoring methods so you can observe each layer of your applications and infrastructure with clarity.
Website monitoring
Monitor websites and APIs using HTTP or HTTPS requests while tracking availability, response times, SSL/TLS validity, and status codes.
Ping monitoring
Verify network connectivity and host availability using ICMP echo requests for servers, routers, and infrastructure devices.
Port monitoring
Confirm TCP port reachability for services such as PostgreSQL, Redis, SMTP, SSH, and other network applications.
Keyword monitoring
Validate page content by checking for a required keyword or phrase within the HTTP response body.
Create your first monitor
Use the Add Monitor workflow to define what Spark Uptime should check, how the target should be validated, and how the service should appear across dashboards, reports, and notifications.
Open your dashboard
Sign in to your Spark Uptime account and select Add Monitor.
Select a monitor type
Choose the monitoring method that best matches your target, including Website, Ping, Port, Keyword, or Heartbeat monitoring.
Name the monitor
Enter a clear nickname that will be used throughout your dashboard, uptime reports, alerts, and notifications.
Enter the target
Add the domain, IP address, URL, hostname, or service endpoint that Spark Uptime should monitor.
Complete monitor-specific fields
For keyword checks, enter the required phrase. For port checks, specify the TCP port. For website checks, provide a valid URL with http:// or https://.
Save the monitor
Select Add New Monitor to begin continuous monitoring from Spark Uptime’s global network.
Manage existing monitors
Monitor management options are available from your account dashboard and each monitor’s detail page. These controls help you adapt to maintenance windows, service changes, and operational updates.
Pause monitoring
Temporarily stop checks without deleting the monitor. Use Resume when monitoring should continue.
Rename a monitor
Update the monitor nickname used throughout dashboards, reports, and alert notifications.
Delete a monitor
Permanently remove a monitor and its configuration. This action cannot be reversed.
Reset incident history
Clear historical incidents and event logs without deleting the monitor itself.
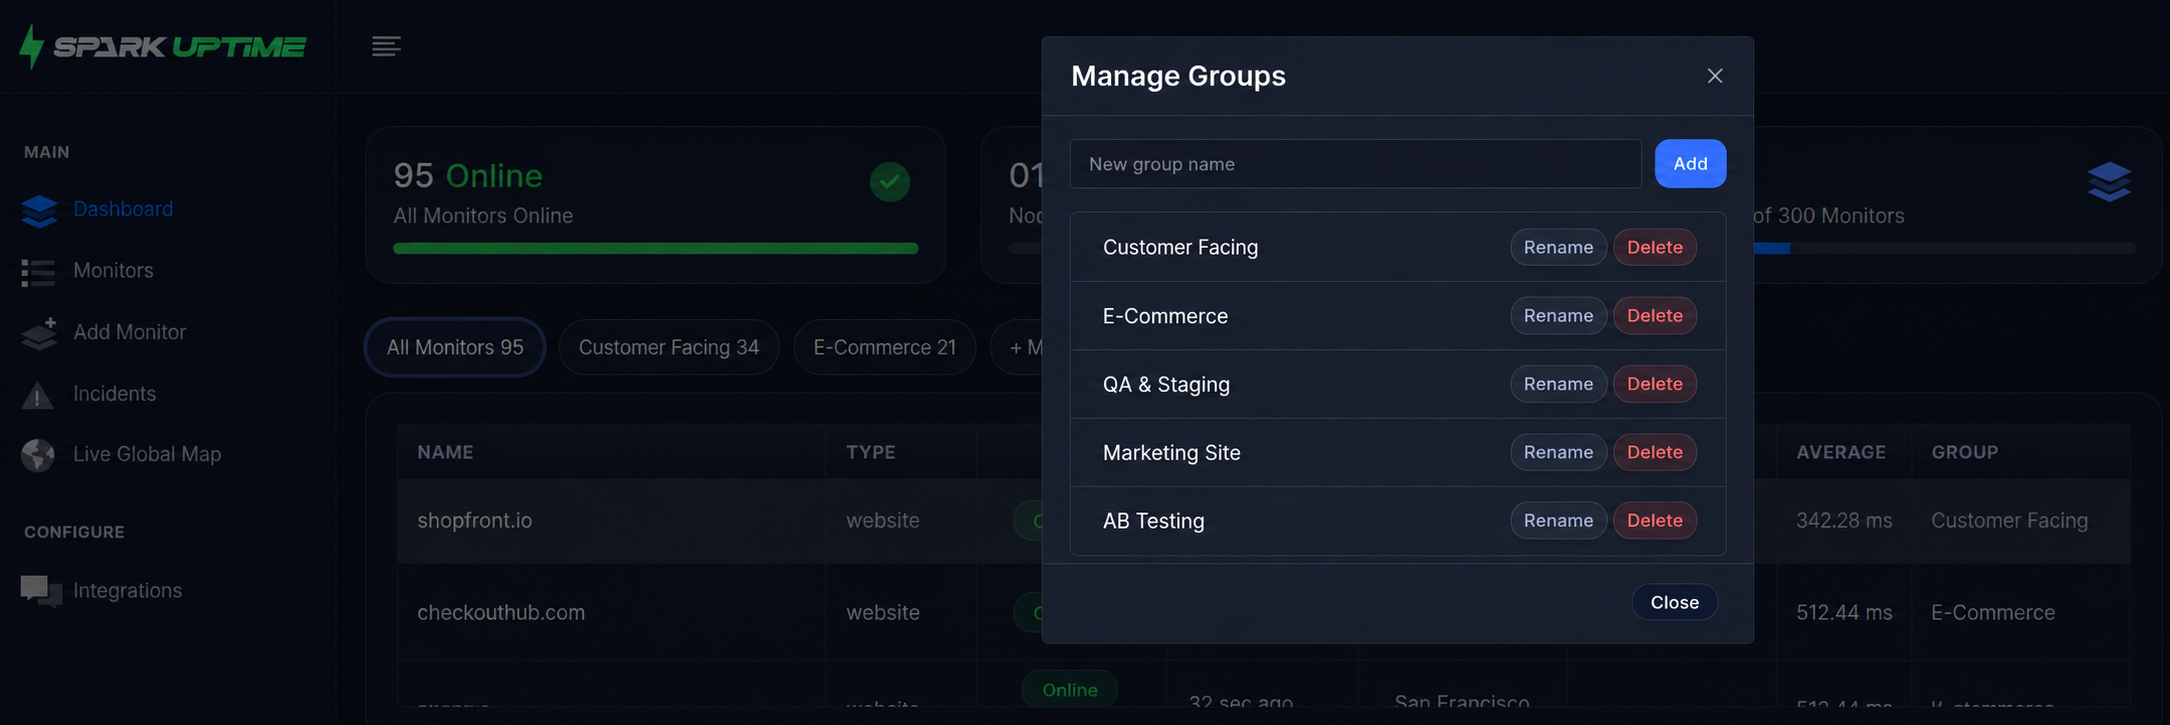
Organize monitors with groups
Groups help you organize monitors by customer, environment, application, location, or infrastructure type for faster navigation and clearer operational visibility.
- Create a group from your dashboard using Add New Group.
- Assign monitors to groups from the monitor list.
- Filter your dashboard by group from the Groups panel.
- Return to the complete monitor list by selecting All Monitors.
View monitoring data
Once active, Spark Uptime continuously collects uptime statistics, response times, HTTP status codes, SSL/TLS validation results, and historical availability metrics.
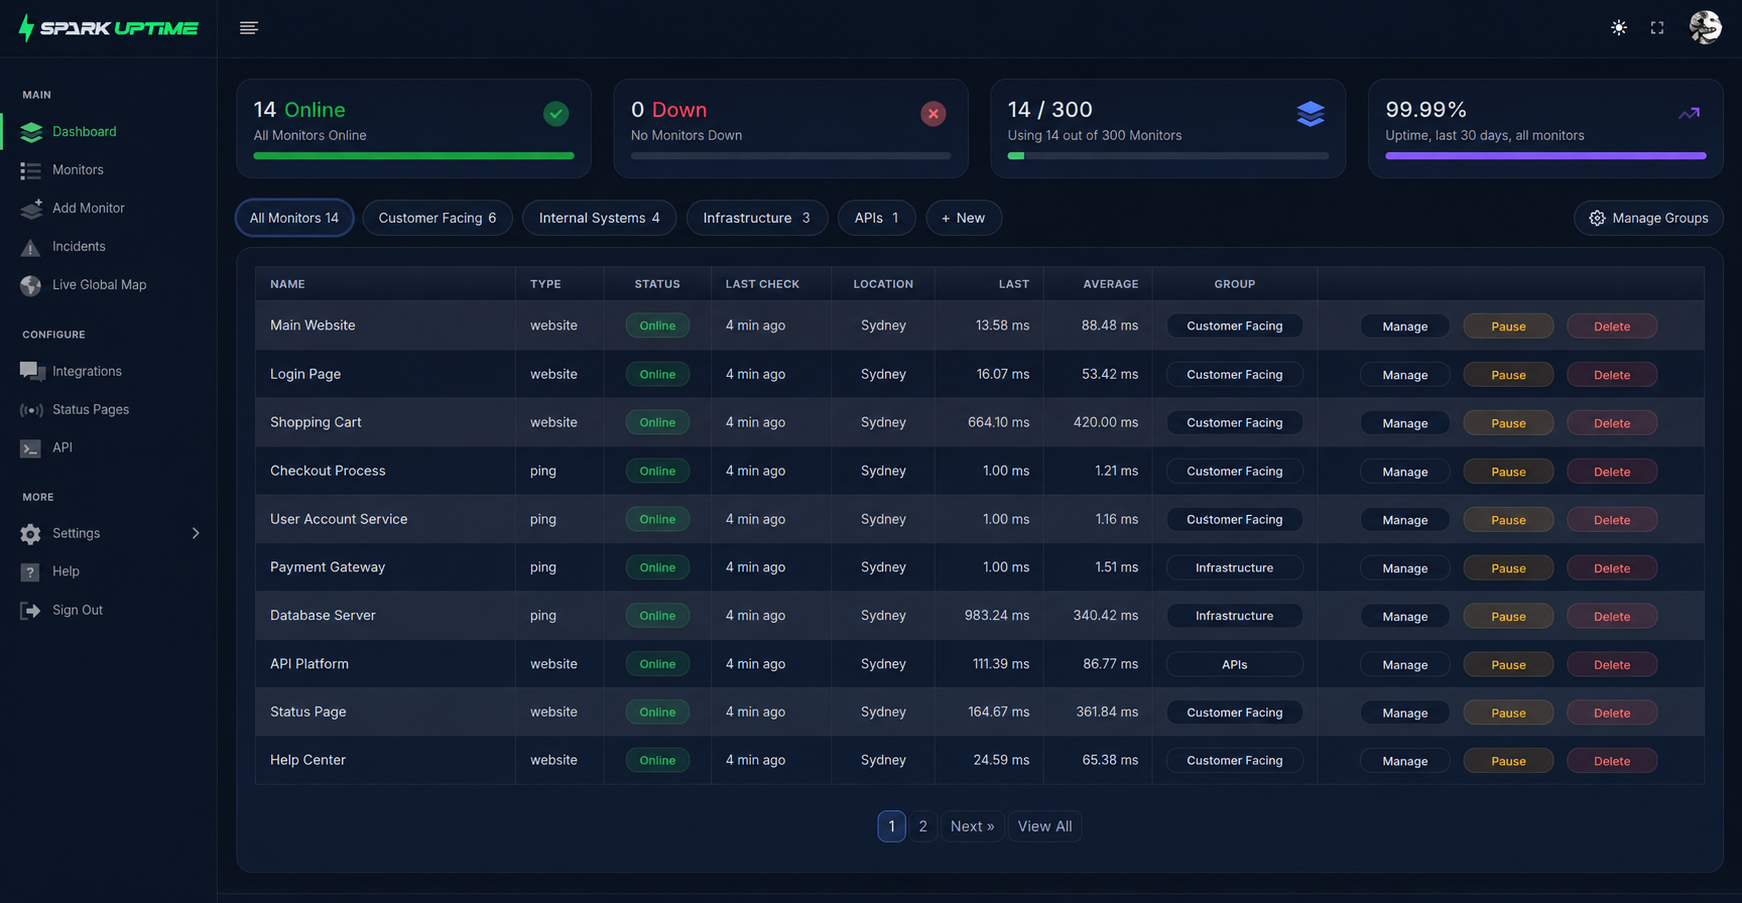
Dashboard overview
Review active monitors, uptime status, current incidents, and high-level availability information.
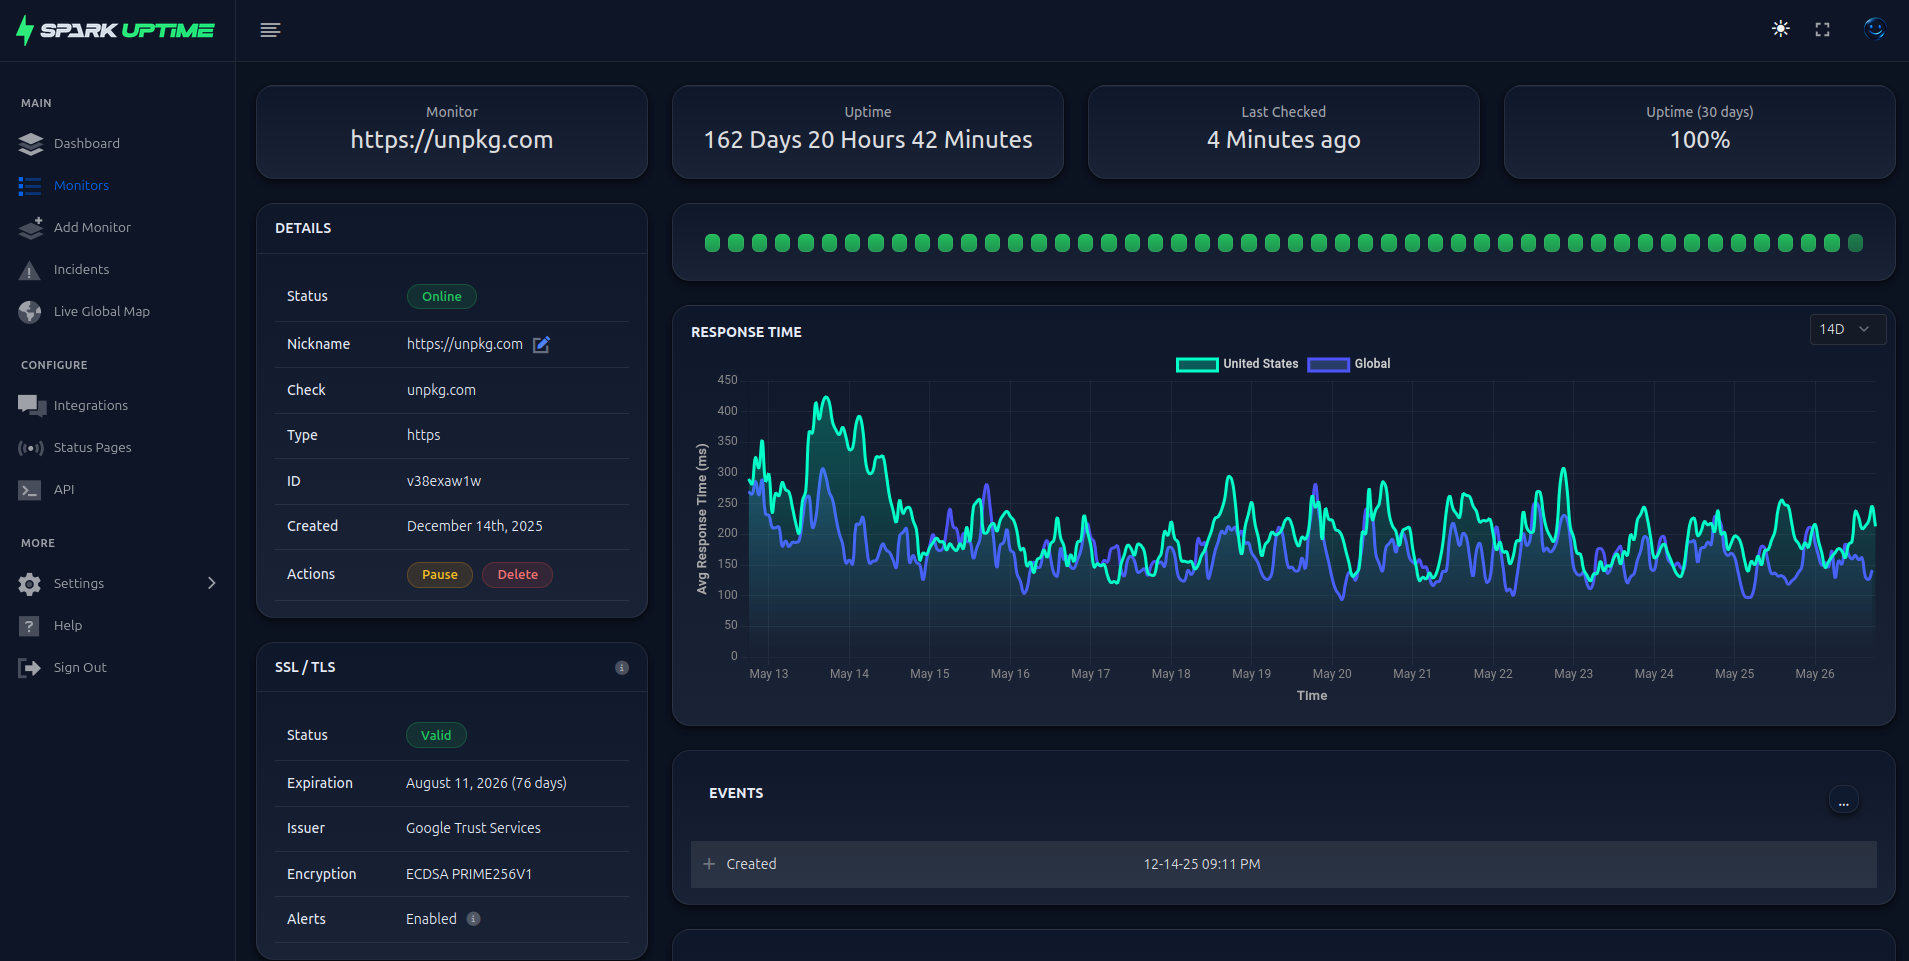
Monitor detail pages
Open an individual monitor to review historical uptime, response times, event logs, and configuration details.
Live Global Map
View real-time monitoring activity, uptime percentages, and the global node currently performing checks.
Uptime reports
Use reporting data to review availability trends, incident history, and service performance over time.